In today’s data-driven world, we help you identify the metrics that matter, transforming data into actionable insights aligned with your goals.
Get Started Use Cooperative Contracts
Organizations today generate a vast amount of data, yet leaders often lack clarity on departmental performance, staff effectiveness, and customer satisfaction. With many tools available, it can be challenging to know what data to prioritize, which reports to create, and how to interpret the results. Defining relevant Key Performance Indicators (KPIs) and keeping data accurate, up-to-date, and accessible are essential to making informed decisions.
Use data to guide critical decisions.
Spot trends and gaps for a competitive edge.
Leverage key metrics to drive continuous improvement.
KPI Development: We help you develop and align KPIs with organizational goals to drive desired outcomes.
Through benchmarking, we help you measure progress against industry standards to stay competitive.
We help you identify and address data gaps and inaccuracies for effective reporting.
We protect data from unauthorized access and ensure compliance with regulatory standards for ethical data handling.
We use familiar tools like SQL and PowerApps for straightforward yet powerful organizational reporting.
We help you build interactive dashboards with BI tools like, Qlik, Power BI and Tableau for real-time insights.
We work across platforms like Snowflake, Databricks, and Synapse for custom data solutions of all sizes.
Featured Client
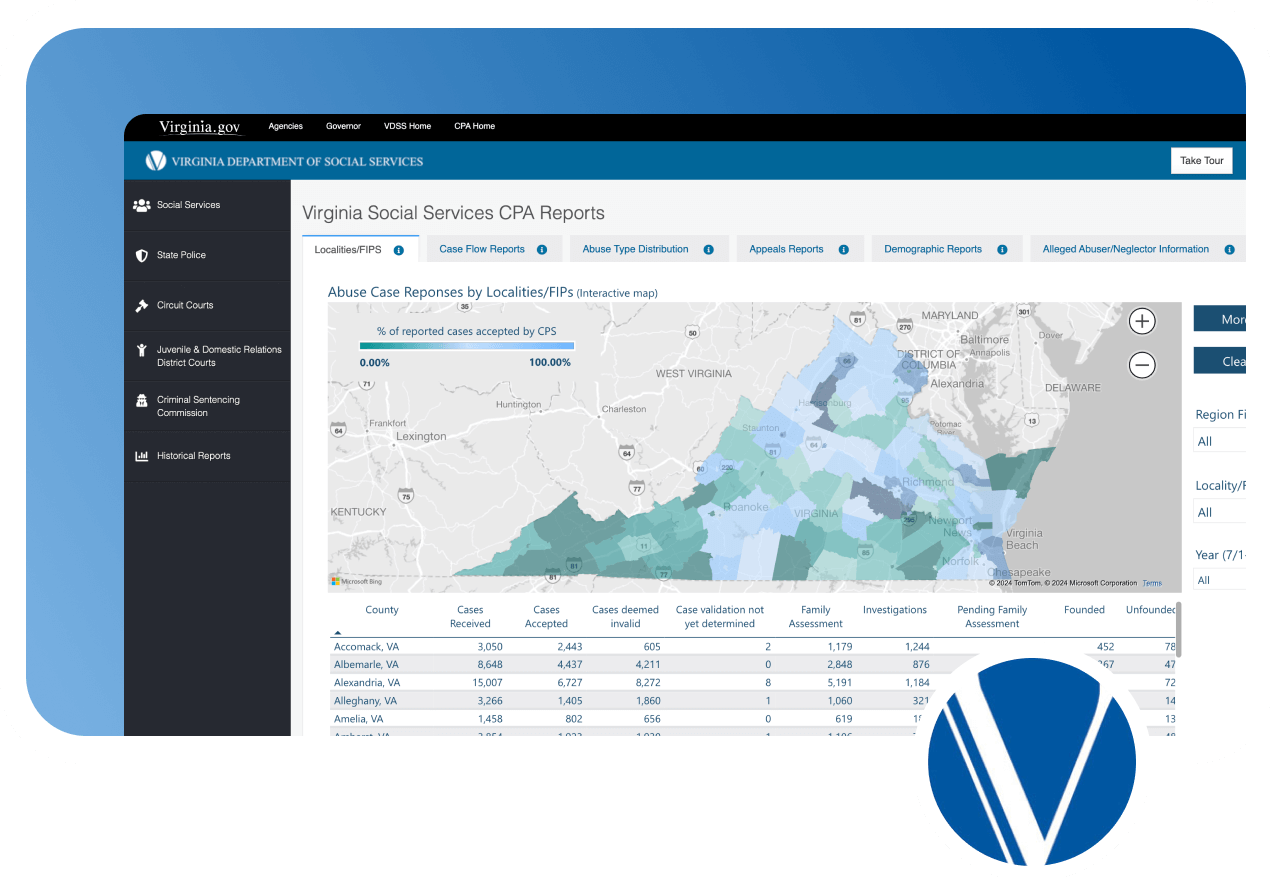
Tech Dynamism partnered with VDSS to create an accessible, data-rich web portal that allows users to explore child abuse and neglect data through engaging, interactive visualizations.

VDSS needed a data visualization portal to make child abuse and neglect data accessible and understandable to the public and state agencies. The platform required stable access for high user volumes and clear visuals to enhance data comprehension.
We developed a data visualization portal using Power BI and Tableau, providing interactive tools for users to explore data easily. Collaborating with VDSS and state agencies, we standardized data feeds and automated validation through an ETL process, ensuring data accuracy and reliability.
The portal improves data accessibility with dynamic visualizations that enhance user engagement and understanding. Interactive tools allow tailored data views, while a stable, scalable infrastructure supports high traffic and ensures reliability for public and agency users.
We assess performance gaps and set clear improvement goals tailored to your organization.
We review your existing tools and data, uncover underused resources, and identify needed enhancements.
We design custom reports and interactive dashboards that highlight key insights for informed decision-making.
We continuously refine tools to ensure data remains accurate, relevant, and actionable.
Contract #24-11-TO-03 - VA Local Gov
VASCUPP Contract #UVA2002927